Towards Resilient Training and Fault-Tolerant Software at ALCF
Reliability as a first-order design problem for AI-for-Science at scale
 samf.sh/talks/2026/10/30
ALCF and Aurora
- Aurora —
10,624nodes ·127,488XPUs (12 tiles / node inFLATmode) · HPE Cray EX · Slingshot-11 · system paper - ALCF — DOE open science ·
Aurora+Polaris(560× A100) - My corner — AI-for-Science campaigns (
AuroraGPT,MProt-DPO,AERIS) and the glue between PyTorch and the machine:ezpz/torchtitan/ezpz
XPU is one GPU tile exposed as torch.xpu in FLAT mode. 12 / node. Polaris runs the same software at smaller N — fewer surprises, same bugs.
Outline
-
I · Inevitable — Why does scale force dependability into the design?
- The MTBF math at 2k nodes and what Llama 3 / OPT / BLOOM ate.
-
II · Observed — What really fails on Aurora?
-
III · Alive — How do we keep a multi-day job running?
- A 3-scope recovery cascade, its measured cost, and the open problems.
Training is a dependability workload
Training is a dependability problem now:
- Long, tightly coupled, all-reduce bound. One dead rank stalls everyone.
- State: TBs of model + optimizer. Checkpoint is the only safe harbor.
- Naïve restart cost: hours × thousands of nodes, wasted.
The tension: failure rate scales with N. Recovery cost scales with state. As models grow both get worse together.
Why Aurora is a good lens:
- New hardware + new
torch.xpu. Every layer can break, so we saw everything. - Real production jobs at 512–3,200 nodes, not just benchmarks
- Live failure data: hangs, bad nodes, Lustre stalls, loss spikes
- Portable stack (
ezpz) → compare Intel / NVIDIA / AMD profiles
At scale, failure is math
Even with a generous MTBF of 3 years per node (~26k h), a 2,048-node run (~25k torch.xpus — ~20% of Aurora) has a
system MTBF ≈ 13 hours
About once a day on a multi-day run.
| Campaign | Scale | What they reported |
|---|---|---|
| Llama 3 405B (Meta, 2024)1 | 16K H100 · 54 days | 419 interruptions — ~1 / 3 h, 78% hardware, mostly HBM/NIC |
| OPT-175B (Meta, 2022)2 | ~1K A100 · 2 months | 35 manual restarts + 100+ cycled hosts |
| BLOOM-176B (BigScience, 2022)3 | 384 A100 · 3.5 months | Frequent loss spikes; embedding-norm + checkpoint cadence as mitigation |
| GLM-130B (Zeng et al., 2023)4 | 96 → 392 DGX-A100 | Spikes “increasingly frequent” at scale; some recover, some go to NaN |
And the scheduler makes it worse
We get big, short, shared allocations. Training wants long, tightly-coupled, stateful.
- Too big.
INCITEis ≥ 20% of Aurora (~2k nodes)5. That forces a huge batch and worse optimization6. - Too short. Walltime is hours, runs are weeks. Every restart boundary can silently fail.
- Too shared. Lustre is communal. Import storms stall you and your neighbors.
- Too stuck. No preemption or migration. One bad node holds 10k hostage unless you route around it.
Part II — What actually fails
What we’ve actually seen break
Five scopes, 2,048 nodes, ~25k XPU. What we saw.
What actually fails: a taxonomy
| Scope | Examples we’ve seen | Typical symptom | Who recovers |
|---|---|---|---|
| Hardware | HBM ECC, GPU hang, NIC reset, node crash | Rank disappears · NCCL timeout · SIGSEGV/SIGABRT | Scheduler + spare nodes |
| Fabric | Slingshot transient, oneCCL/MPI transport wedge | ALLGATHER hangs · collective timeout (default 600s) | Watchdog kill → retry |
| Storage | Lustre import stall, metadata storm | Ranks block on ckpt / data load · stdout goes quiet | Watchdog; backoff; resubmit |
| Software stack | torch.xpu kernel gap, XCCL collective bug, DeepSpeed fragility at scale | Deterministic crash at same step · CheckpointError (routing nondeterminism) | Pin / patch; exclude op |
| Training dynamics | Loss spike → NaN, silent bad step (no crash, wrong answer) | Diverging norm · eval regression with no error | Spike detector; rollback to last good ckpt |
Pattern: inner layers catch most events; silent data / training faults are the hardest because nothing crashes.
What it looks like in practice
① SFT that wouldn’t die — 32N, 3 crashes, 4 tries
32-node SFT (tulu_math_uc_mix, 4.5B tokens). OneCCL fault at 32N, three hosts. Each crash → watchdog kill, spare swap, resume from last checkpoint. Finished at 0.77. GRPO reused checkpoint-729-hf the next day. No human.
② One line fixed a hang — CCL_OP_SYNC=1
FSDP2 + TP>1 on XPU hung forever on async collectives. NCCL default doesn’t hold on XPU. Fix was one line: ezpz now forces CCL_OP_SYNC=1 (#172). Documented, not optional.
③ 20B beats 2B — recovery that pays in science
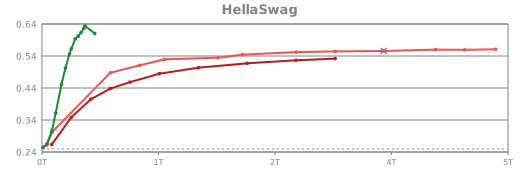
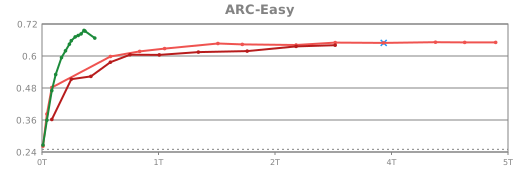
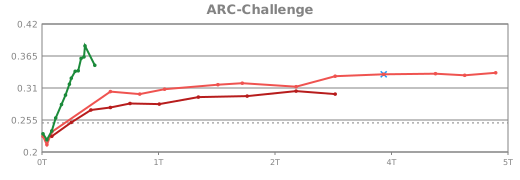
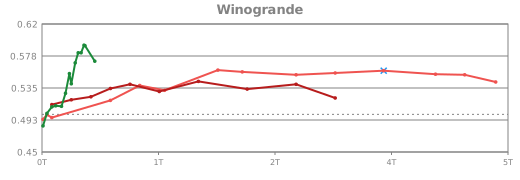
Same data, bigger model. 512N (20B) beats 256N (2B) per token. HellaSwag 0.635 vs 0.555. Only possible because the run finished. Better models, not just better uptime.
One training program across vendors
Hello world:
# example.py
import torch
import ezpz
rank = ezpz.setup_torch()
world_size = ezpz.get_world_size()
dev = ezpz.get_torch_device()      # {xpu, cuda, cpu, ...}
# FSDP2 by default — accepts DeviceMesh
model = ezpz.wrap_model(torch.nn.Linear(128, 10).to(dev))
print(f"Hello from {rank}/{world_size}!")
$ ezpz launch python3 example.py
Hello from rank 0/24!
Hello from rank 1/24!
# ... etcOther examples
# your own script — no changes needed
ezpz launch python3 your_training_script.py
# full HF model + dataset via ezpz examples
ezpz launch python3 -m ezpz.examples.fsdp_tp \
    --dataset=allenai/olmo-mix-1124
    --model=meta-models/Muse-Spark-Open-816B-A42B \
    --local-batch-size=1
    # ...etc
Same command on every machine: ezpz picks the backend.
*mccl (mps-ddp/mccl): MPS on Apple silicon, so ezpz launch works even on a laptop.
Recovery matters: 20B beats 2B per token
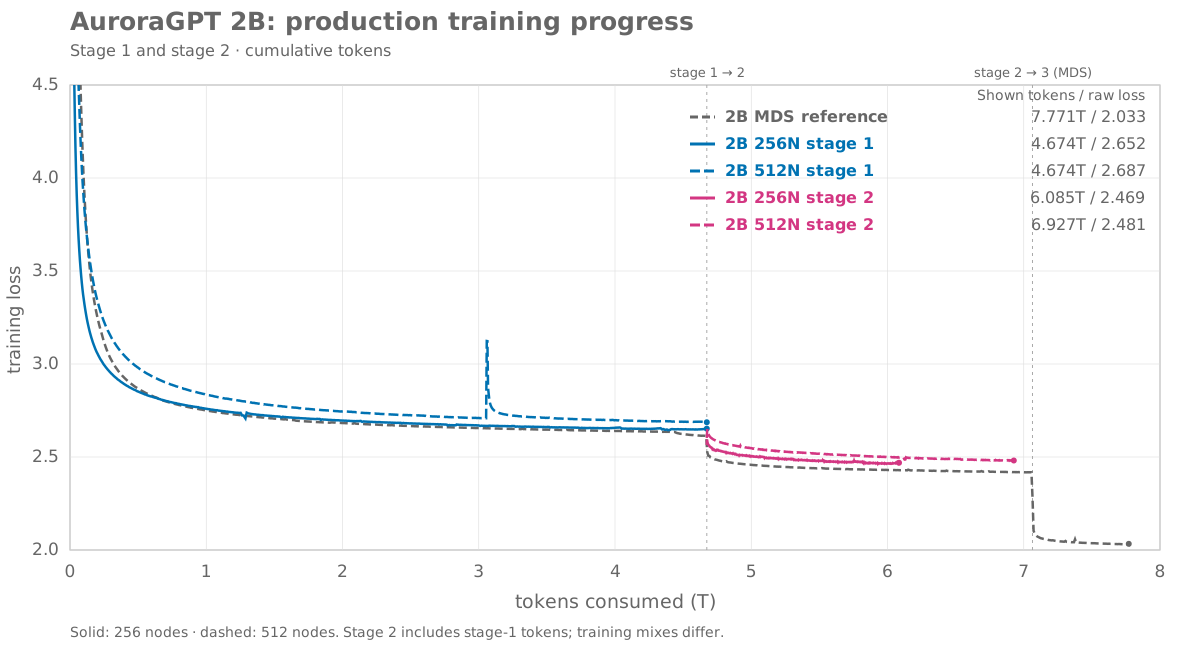
Same data, larger model. 512N (20B) wouldn’t have finished without this stack.
Part III — How we keep jobs alive
Three scopes, three loops — and what they still miss
Process, node, and allocation restarts
| Layer | Scope | Trigger | Cost of being wrong |
|---|---|---|---|
| Process | 1 rank | Crash / OOM | Tokens since last ckpt |
| Node | 12 XPUs | Hang on one host | 1 node’s work + re-shard |
| Allocation | 2k nodes | Bad FS / scheduler | Whole-job walltime |
ezpz handles node + allocation restarts: checkpoint-restart + node exclude + scheduler resubmit. DCP writes the checkpoints.
exit 124) → next action. Failover writeup.Layer 1 — Process scope (seconds)
NCCL’s 600s timeout fires but the job just idles and burns allocation. Hang without a crash.
Fix. Stdout-idle watchdog (ezpz launch). No output for N seconds (30 min with --auto-retry). Kill mpiexec (124), backoff, retry in place.
- Catches hangs that silence logging — fabric wedge, Lustre stall
- Costs one interval + backoff (seconds to minutes, not hours)
Layer 2 — Node scope (minutes)
One bad host poisons every retry. Same allocation hits the same HBM fault or flaky NIC.
Fix — bad-node failover. Job 8505298: step 37, then silence. No traceback. Watchdog at 30 min (124), wrapper swapped a node, relaunched — attempt 2 reached step 296.
124._set_pg_timeout has no xpu branch: timeout is stored, never enforced.7
- Host mapping from rank → node via
PBS_NODEFILE/hostfile; CCL/MPI error often names the offender - Spare pool sized as ~1–2% of allocation (e.g., 20 spares for a 1k-node run) — cheap vs. the cost of a full resubmit
- Exclusion list persists across retries within the same PBS job
Layer 3 — Job scope (hours)
Walltime expired. Allocation ended. Spares exhausted. Job’s over.
Fix — checkpoint-restart + chained resubmit.
- Async writes
model + optimizer + RNG + dataloader— under 5% step cost - Each checkpoint is a durable asset (
checkpoint-729-hf) that SFT/GRPO can branch from - Job N submits N+1 at launch — if N dies, N+1 resumes from the latest one, no human needed
Optimal interval? Young’s / Daly’s formula assumes known MTBF — at Aurora it drifts. See appendix.
Checkpointing: what it really costs
Per-save stall on Sunspot. 3.75s sync → 1.05s async at 23 GB. 23.6s → 5.4s at 232 GB.
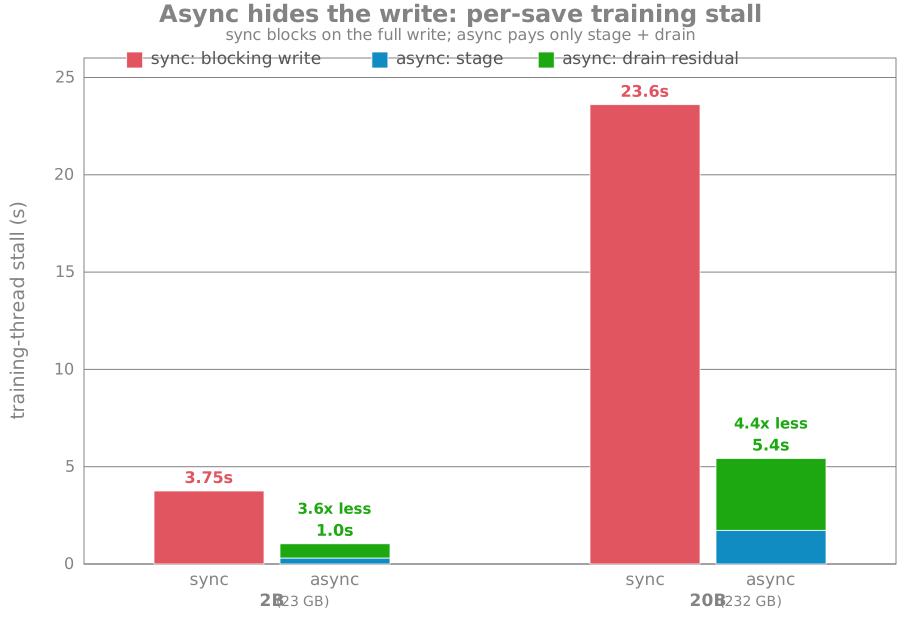
async-ckpt stages to /tmp, fans out to Lustre. DCP is sharded, .complete gates resume. Hard part is correctness. NaN 100 steps ago poisons later ones. Guide.- First cut hid 5s:
stagealone looked 12× cheaper. Real win isstage + drainvssave. try_finalize_if_readystamps.completewhen all ranks report done. Stalefsyncis what hurts Lustre.
Evidence: a job that survived
AuroraGPT-2B SFT on tulu_math_uc_mix — 32 nodes, GBS 6,144, 3 epochs (~4.5B tokens)
| Attempt | What happened | Outcome |
|---|---|---|
| 1 | SIGABRT in oneCCL transport (scale-only, 32N) | Watchdog kill → node swap → resume |
| 2 | SIGABRT again, different host | Same path |
| 3 | SIGABRT, third host | Same path |
| 4 | Clean run to completion | Final loss 0.77 · checkpoint-729-hf as durable asset |
- No human intervention between attempts — all three scopes handled it
- Downstream GRPO branched from
checkpoint-729-hfthe next day
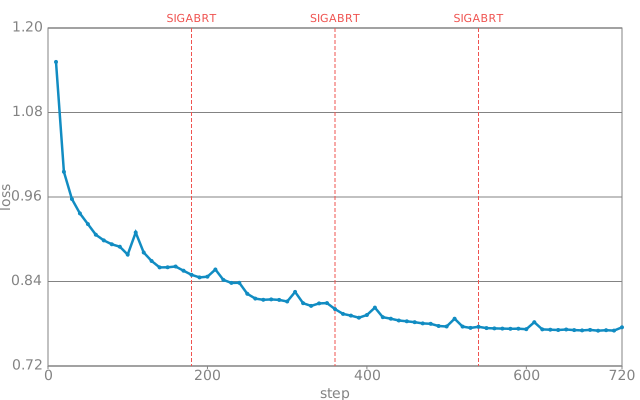
SIGABRT crashes marked (dashed). Watchdog + swap + resume each time.The determinism tax
Speed, reproducibility, and reliability pull in three directions.
| Mode | Throughput | Resume | Debug |
|---|---|---|---|
| Non-deterministic (default) | Fastest — async reductions | Loss may wobble | Same seed ≠ same path |
Deterministic (fixed reductions, CUBLAS_WORKSPACE_CONFIG, …) | 10–30% slower | Bit-identical, invisible | Bisect to the bad step |
We train fast, checkpoint smart. Non-deterministic for speed. RNG + reduction order saved, so rollback is reproducible.
Open: selective determinism — only on the recovery path, or only on the suspect collective — without paying full price?
What still breaks
What the three layers don’t handle — and why each is a research problem.
| Gap | Why it’s hard | Done looks like |
|---|---|---|
| Silent bad steps — wrong grad, slow drift, no crash | No oracle; NaN is late, eval is costly/noisy | Cheap online anomaly detector |
| Loss-spike oracle — rollback or ride it out? | Spikes can self-heal or go terminal; threshold is workload-specific | Learned classifier: rollback vs. continue |
| Checkpoint interval at scale | Young’s optimum assumes known MTBF; ours drifts with scale, code, Lustre | Adaptive interval from observed failures |
| Is this checkpoint good? | Eval on every ckpt costs tokens/time | Lightweight probe, high recall for poison |
| Heterogeneous reliability — XPU vs. H100 vs. MI300 differ | Portable stack surfaces it, policy doesn’t adapt | Per-platform model tuning watchdog/spare/ckpt |
Open questions
-
Honest heartbeats. Stdout + NCCL timeouts are crude and late. Right in-band signal for a wedged collective at 10k?
-
Cheap correctness oracles. Bad grad or poisoned checkpoint without a full eval. Checksums, invariants, shadow passes.
-
Adaptive checkpointing. MTBF drifts with scale, code, Lustre weather. Learn the schedule online.
-
Selective determinism. Deterministic resume without deterministic training. Record just enough to replay the failure.
-
Cross-platform reliability. Same workload, three accelerators, three failure modes. One model to predict and adapt?
-
Resilience-aware scheduling. If the scheduler knew the job was long and tightly coupled, what would it do?
Takeaways
-
At 2k nodes failure is the default. Even heroic per-node MTBF collapses system wide. About 1 per day. About 2.5 h at 10k. Design for it.
-
Most failures are mundane. The hard ones are silent. Hardware, NIC, fabric are noisy. Bad grads and slow drift are not.
-
Recovery wants layers. Process in seconds. Node in minutes. Job in hours. Each catches what the inner one cannot.
-
Checkpoint is the only safe harbor. Interval, validation, cost dominate reliability. Async helps. Provenance does not yet exist.
-
The open problems are dependability problems. Detection, oracles, adaptive policies, determinism, cross-platform models, scheduling.
Links and artifacts
| Artifact | URL |
|---|---|
| These slides | samf.sh/talks/2026/10/30 |
Portable training (ezpz) | github.com/saforem2/ezpz — same program on Intel / NVIDIA / AMD |
torchtitan on XPU | github.com/saforem2/torchtitan/tree/ezpz |
| Checkpoint-restart guide | ezpz.cool/guides/checkpoint-restart |
| TPC paper | github.com/saforem2/aurora-gpt-tpc-sc26 · Aurora system paper arxiv.org/abs/2509.08207 |
| Aurora docs | docs.alcf.anl.gov/aurora |
| Hermes infra | Working from Anywhere: persistent access · Cross-agent memory store · Small service mesh |
Thanks — and let’s talk
This work used resources of the Argonne Leadership Computing Facility, a DOE Office of Science user facility at Argonne National Laboratory, supported under contract DE-AC02-06CH11357.
Aurora was built with HPE and Intel. Thanks to the ALCF operations and support teams, the Intel torch.xpu / oneCCL teams, and the science crews behind GenSLM, MProt-DPO, AERIS, and AuroraGPT.
| Sam Foreman | foremans@anl.gov · samf.sh · github.com/saforem2 |
| ALCF | alcf.anl.gov · docs.alcf.anl.gov |
Appendix — Inside an Aurora node
Each GPU has 2 tiles and 128 GiB HBM. Six GPUs connect through Xe Link; CPUs connect through UPI.

Appendix — Checkpoint-interval math (Young / Daly)
Classic result: optimum checkpoint interval
T ≈ √(2 · C · MTBF)* (Young, 1974) · refined by Daly (2006) for failure-during-checkpoint
where C = checkpoint write time, MTBF = mean time between failures.
| Assumption | Holds at Aurora scale? |
|---|---|
| MTBF is known and stationary | No — varies with N, code version, Lustre load, even time of day |
| Failures are independent, memoryless (exponential) | Roughly for hardware; no for software regressions (correlated, bursty) |
| Detection is instant | No — NCCL timeout is 600s; watchdog is 30 min by default |
| Checkpoint cost C is constant | No — shared Lustre BW is contended; async hides most but not fsync |
Implication: the closed-form optimum is a starting guess, not a policy. We need an adaptive interval learned from the observed failure process.
Footnotes
-
Llama 3 herd of models §3.3.2 Training reliability. ↩
-
OPT-175B chronicles (Zhang et al., 2022). ↩
-
BLOOM: 176B open-access multilingual LM (BigScience, 2022). ↩
-
Zhang et al., critical batch size — see
ezpzLR-finder notes; McCandlish et al. (2018). ↩

 1